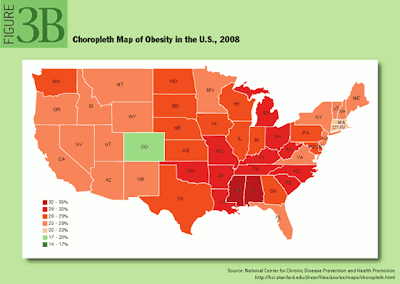
Choropleth maps, like the one above showing the frequency of obesity by state, use shading of areas to display different concentrations of a certain variable. We can form opinions of how and why there are variations between regions in the US for obesity and what the culture and eating habits of these places may be.
No comments:
Post a Comment